Houston, TX | July 31, 2026
Most compressor shutdowns explain themselves. A unit trips on high jacket water temperature in August and nobody needs a tool to work out why.
Then there is the other kind. SPARE (Mechanical). Low oil pressure. High stage 1 discharge temperature, again, for the fourth time this month. The panel tells your team what stopped the machine without telling them why it stopped. So the digging starts. Someone opens trends. Someone else pulls alarm history. A third person tries to remember whether this unit did the same thing three weeks ago.
That dig takes about thirty minutes when it goes well. It takes considerably longer when it does not, and sometimes it ends without a real answer at all.
That is exactly why we built Root Cause Analysis into OneView Compression™.
Compressor shutdown root cause analysis is the process of reviewing shutdown codes, alarm history, downtime events, and sensor behavior to determine why a compressor stopped and what should be checked next.
OneView helps compression teams investigate difficult shutdowns faster. It automatically brings together alarm history, downtime events, and sensor trends, then identifies likely causes and recommends what to check next. This can reduce an investigation that normally takes about 30 minutes to roughly 30 seconds.
Key Takeaways:
- Only 5 to 10 percent of shutdowns need real investigation, but those are the ones that consume the time.
- OneView compiles the alarm, downtime, and measurement history around a shutdown automatically, then offers an AI analysis to interpret it.
- The framework behind the analysis is configurable per organization and improves through user feedback.
- AI is one more tool in your team's toolbox. Your mechanics, operators, and technicians remain the experts.
Why are Difficult Compressor Shutdowns So Costly to Investigate?
An average compressor package can see 100 or more shutdown events in a year. Most are self-evident, resolved from the panel, or already understood before anyone opens a screen.
Call it 5 to 10 percent that genuinely require someone to sit down and reconstruct what happened. On a single unit, that is somewhere between five and ten real investigations a year. On a 200-unit fleet, it is well over a thousand.
At roughly thirty minutes each, that is several hundred hours a year of skilled people rebuilding timelines by hand — and those are your most experienced people, because they are the only ones who can do it well. Run the arithmetic against your own fleet size and shutdown rate and the number gets uncomfortable quickly.
Root Cause Analysis targets that specific slice of work. Not the routine trips. The ones where nobody is sure yet.
What Does a Difficult Compressor Shutdown Investigation Look Like?
Real Compressor Shutdown Example
A case came to us recently that shows why these are hard.
A unit kept tripping on high stage 1 discharge temperature. Read at face value, that is a cooling problem or a load problem, and that is where most people start looking.
It was neither. The cause-and-effect sequence looked like this:
- Liquids accumulated in the scrubbers.
- Liquid carryover damaged the suction and discharge valves.
- The damaged valves increased discharge temperature.
- High discharge temperature ultimately tripped the unit.
The alarm named the fourth link in the chain.
Finding that correlation requires either twenty years of hands-on compression experience or a tool that can look at the whole picture at once. Those are the only two options, and the first one is getting harder to staff for.
A repeating temperature trip, liquid-management alarms elsewhere in the history, and a measurement drift pattern in the hours beforehand are three separate signals in three separate screens. The connection between them is the answer.
That is the kind of pattern this is built to surface. It does not declare the verdict. It puts the right three signals in front of a person in the same view, in the right order, in seconds instead of half an hour.
Video Overview
This video shows the complete Root Cause Analysis workflow in OneView, from selecting a shutdown event to reviewing the likely cause, supporting evidence, recommended checks, and restart guidance.
How Does OneView Analyze a Compressor Shutdown?
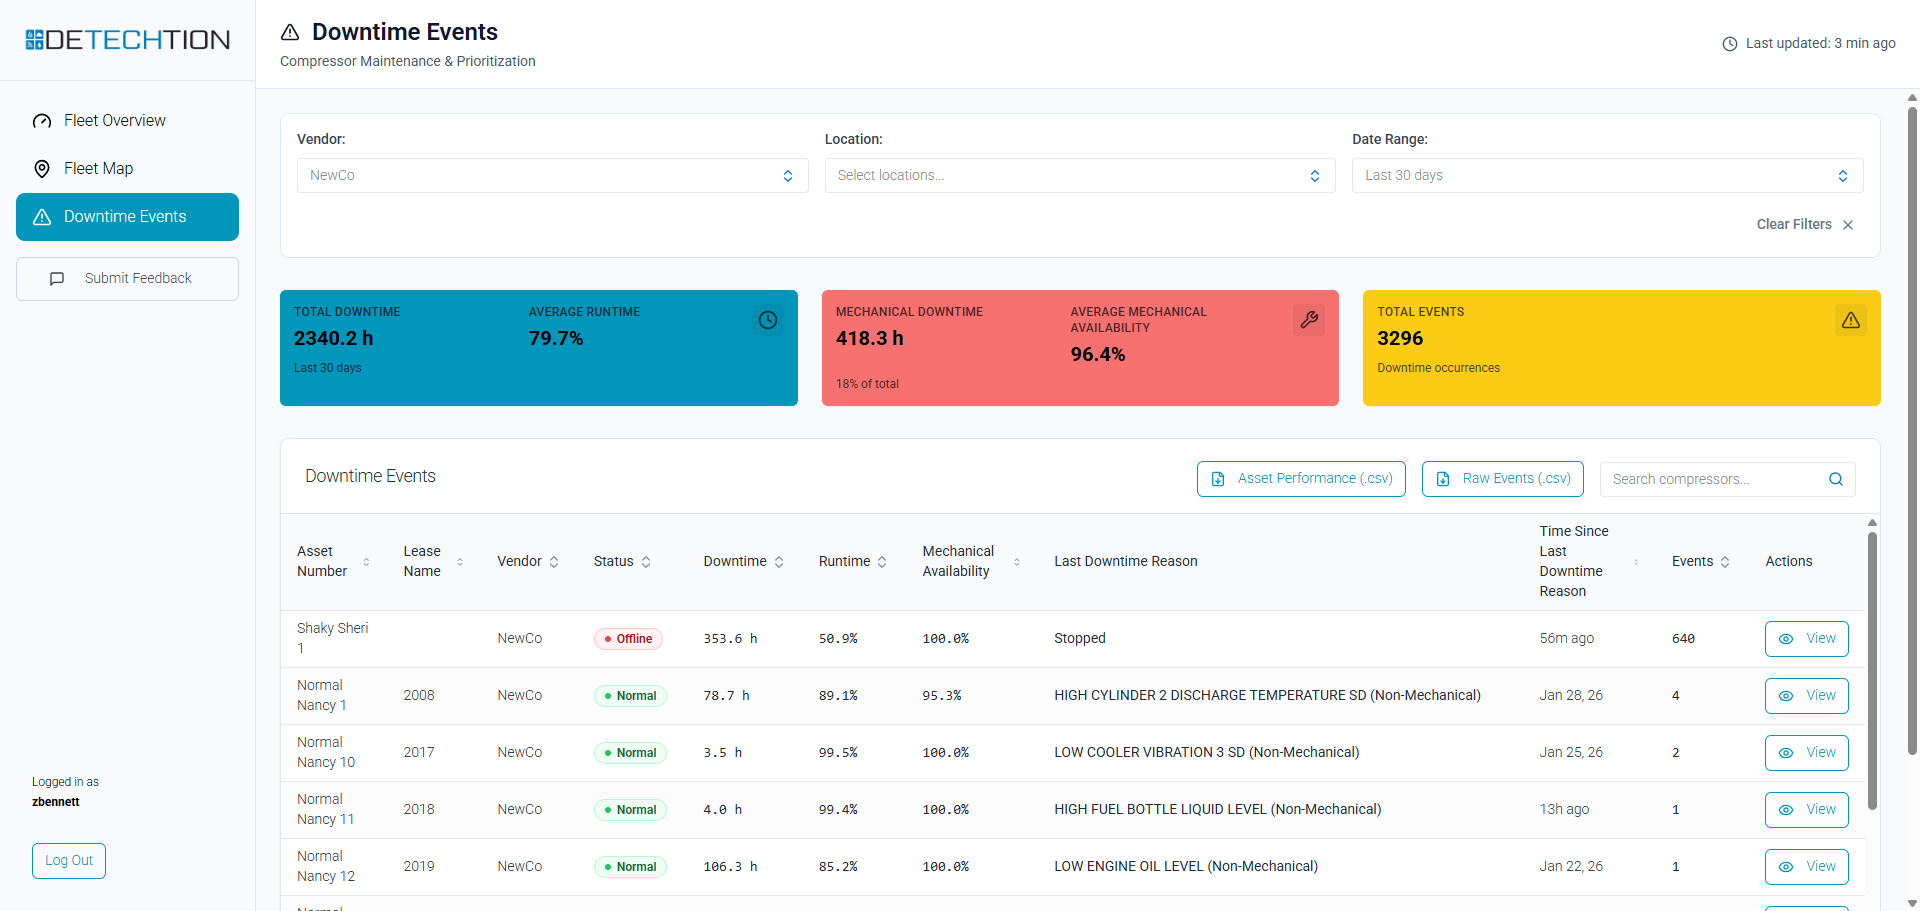
Root Cause Analysis lives on the asset page in OneView, alongside Asset Vitals, Trends, and Downtime Analysis. It works in two stages.
Stage 1: OneView Compiles the Evidence
Select a shutdown event and OneView assembles what surrounds it:
- Shutdown events for the asset, so you can pick the trip worth investigating
- Alarm history for 30 days, most recent first, showing what fired at the event and what fired in the hours before it
- Downtime history for 30 days, including total hours down, which is what makes repeat failures visible as repeats
- Measurements for a 3, 6, 12, or 24 hour window before the trip, including
Pre-Shutdown Drift Summary that compares the last two hours against the earlier part of the window and flags what shifted meaningfully against its own observed range
Even without the AI step, the timeline your team used to build manually is already built.
Stage 2: The AI Analysis Interprets the Evidence
Click Explain this shutdown and the analysis reads the compiled alarm, downtime, and sensor data and returns a consistent structure:
- What Happened — the trip alarm in plain language, and the most likely underlying cause
- The Story Leading Up To It — the alarm pattern and sensor behavior that led into the shutdown
- Pattern Check — whether this is a one-off, a repeat, or a worsening condition
- What To Do Next — a short, prioritized checklist of field-appropriate actions
- Restart Guidance — whether a restart is reasonable yet, or whether it should wait
- Risk Level — a Low, Medium, or High concern rating, with a reason
The advantage is not that AI knows more about compression than your team does. It is that it reads a large volume of alarm and sensor data quickly and surfaces the patterns that deserve attention. That is a useful thing to hand a foreman at 2:00 AM.
Does AI Replace Compressor Experts and Field Experience?
Worth being direct about: AI is one more tool in the toolbox, not a replacement for experience.
Your mechanics, operators, and technicians know the equipment, the operating conditions, and the field realities that never reach a historian. They know which unit has a nuisance sensor, which road washes out, and which symptom turned out to be something else entirely last spring. An analysis built from telemetry cannot see any of that.
Root Cause Analysis is a starting point that shortens the search, not a verdict that ends the conversation. Every analysis in OneView carries that framing on screen, with a clear prompt to verify findings against physical inspection, OEM guidance, and qualified engineering judgment before acting.
How Does OneView Produce a Reliable Root Cause Analysis?
Because this workflow touches restart decisions, most of the engineering effort went into constraints rather than capability. The analysis operates inside a defined framework:
1. Ranked Evidence Hierarchy
Not all evidence carries equal weight. A specific controller, engine, or VFD shutdown code outranks the trip alarm. The trip alarm outranks corroborating sensor trends. Sensor trends outrank repeating alarm history, which outranks generic fault reference knowledge. General knowledge is never allowed to override stronger live data.
2. Compression-Specific Diagnostic Logic
The framework encodes how these packages actually behave: what low suction pressure usually means versus high, why interstage pressure points to the stage before or after it, and what scrubber high level implies for hydro-lock risk.
It is written for reciprocating natural gas packages, including Ariel-type multi-stage units, Caterpillar and Waukesha drivers, and electric motor and VFD packages. It is not written for air compressors or generic rotating equipment.
3. Data-Quality Screening
Field sensors fail in recognizable ways. They may freeze at one value, report zero while the machine is clearly running, or produce a physically impossible reading. The framework flags those sensors as suspect and refuses to build a diagnosis on top of them.
4. Restart Safety Gate
For a defined set of conditions, a casual restart recommendation is not permitted. These conditions include:
- Lubrication loss
- Scrubber or interstage high level
- An unresolved emergency stop
- Ground fault
- Missing motor phase
- Repeated trips with rising vibration or temperature
- An unknown cause after several recent repeats
The instruction is explicit:
Do not attempt restart until the fault source is physically checked and corrected.
5. Hard Prohibitions
The analysis cannot recommend bypassing, defeating, or ignoring a shutdown, permissive, interlock, or safety device.
It cannot invent a controller code, sensor reading, event detail, or repair history. Where the data supports likelihood rather than certainty, it has to say so.
Those constraints are what make the output usable in the field. An analysis that sounds equally confident about everything is not more helpful. It is less trustworthy.
Can OneView Root Cause Analysis Match Our Operating Procedures?
No two compression organizations run identical procedures. Terminology differs. Restart authority differs. What an acceptable next step looks like for a contract mechanic is not always what an owner-operator’s technician would do.
The framework is configurable per organization. The domain rules, diagnostic logic, output sections, and restart gates can all be tuned to how your team operates and how your people talk about equipment.
That tuning is driven by your own users. Under every analysis, users mark it Helpful or Not Helpful. When something misses, they can explain what missed:
- Incorrect diagnosis
- Too generic
- Missed the root cause
- Wrong terminology
- Recommendations not practical
- Did not use the sensor data well
- Hallucinated information
That feedback is the input we use to refine the analysis for your organization. The tool gets closer to your operating procedures the more your team uses it.
What Data Does OneView Use for Root Cause Analysis?
This works because the data underneath it is already unified. OneView connects to existing telemetry, including Enbase and third-party systems, and normalizes runtime, measurement, alarm, and downtime data across vendors into one fleetwide view, with no proprietary hardware required.
That foundation is what makes a credible shutdown explanation possible. You cannot reason about a 30-day pattern if every vendor defines those events differently.
For teams looking to move further upstream, from explaining shutdowns to preventing them, the same standardized data can feed digital twin analytics through Enalysis and support a path toward failure prevention and predictive maintenance.
How Much Time Can OneView Save During Shutdown Investigations?
A shutdown alarm will always be the beginning of a question rather than the answer to one. What changes is how long your team spends getting from that alarm to a defensible understanding of what happened and what to check first.
Thirty minutes to 30 seconds, on the small share of events where it actually matters, across every unit in the fleet. Your teams spend less time searching for answers and more time solving problems.
Schedule a OneView demo to see Root Cause Analysis run against your own fleet data and talk through how the framework would be configured for your operating procedures.
Frequently Asked Questions
What data does OneView use to analyze a compressor shutdown?
OneView analyzes shutdown events, alarm history, downtime history, and sensor measurements from the hours and days surrounding a trip. It combines data from Enbase and supported third-party telemetry systems into a standardized fleetwide view, allowing the analysis to identify patterns that may otherwise be separated across multiple screens.
Does OneView determine the final root cause?
No, OneView Root Cause Analysis identifies the most likely cause, presents the supporting evidence, and recommends what the team should check next. It is designed to shorten the investigation, not replace physical inspection, OEM guidance, qualified engineering judgment, or the field experience of mechanics, operators, and technicians.
Can the analysis be configured for different operating procedures?
Yes, the diagnostic rules, terminology, output sections, and restart gates can be configured for each organization. User feedback also helps refine the analysis over time so that its explanations and recommendations more closely reflect the organization’s equipment, operating procedures, terminology, and practical field expectations.
Can OneView recommend whether a compressor is safe to restart?
OneView provides restart guidance based on the available evidence and defined safety rules. For conditions such as lubrication loss, high scrubber level, unresolved emergency stops, or repeated worsening trips, it will require a physical check and correction before restart. Final restart decisions remain with qualified personnel.
About the Author
Zachary Bennett is senior product manager at Detechtion.AI. He has more than 12 years of experience in energy, engineering, and technology. His background includes work in oil and gas, compression, and software, with a focus on digital solutions for producers and compressor leasing companies that bridge field and office needs.
At Detechtion.AI, Zachary leads the development of digital solutions that monitor, control, and optimize compression fleets. He works with engineering, sales, and customer success teams to ensure products deliver real-world operational impact.
%20(1).png)